How to create scripted fields in Kibana using Painless


What is a scripted field in Kibana?
Kibana is really good at searching and visualising data held in ElasticSearch indexes. When you need to go outside of what is in that index however - this is where scripted fields come into play.
Some great use cases for scripted fields (in my experience):
- You want to aggregate (e.g. by
SUM) on a field that it not natively an integer in ElasticSearch - You want to combine 2 or more fields into a single field (e.g. hostname + request path to make a full URL)
- You wish to create a common filter that others can use, and be able to update the filter in one place (e.g. "is a robot request", "internal staff requests" etc)
I would recommend reading (and watching) the content on scripted fields in the documentation.
Real world example of scripted fields
For my particular use case, I wanted to generate a report in Kibana that listed:
- The aggregate of backend response times from HAProxy
- Broken down by whether the request came from an uptime monitoring bot (e.g.
Pingdom,StatusCakeetc)
The idea being to measure the impact of these uptime bots on the overall platform and its resources. Normally these uptime robots are hitting very heavy pages (e.g. the homepage) and often bypass caching through the use of cookies and HTTP headers.
Converting a string to an integer
The first problem was that backend response time was stored in ElasticSearch as a string 😬. ElasticSearch cannot perform any complex aggregation on string fields (only count). So the first task was to create a new scripted field that converted this field to an integer.
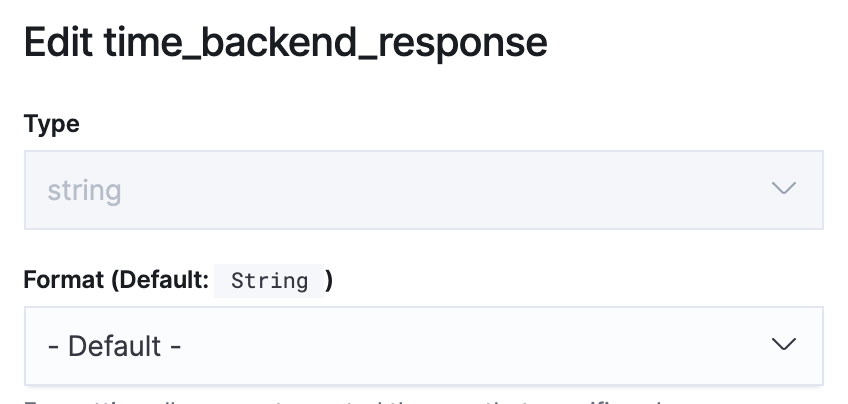
backend response time was stored as a string in ElasticSearch.The resulting scripted field was simple to create:
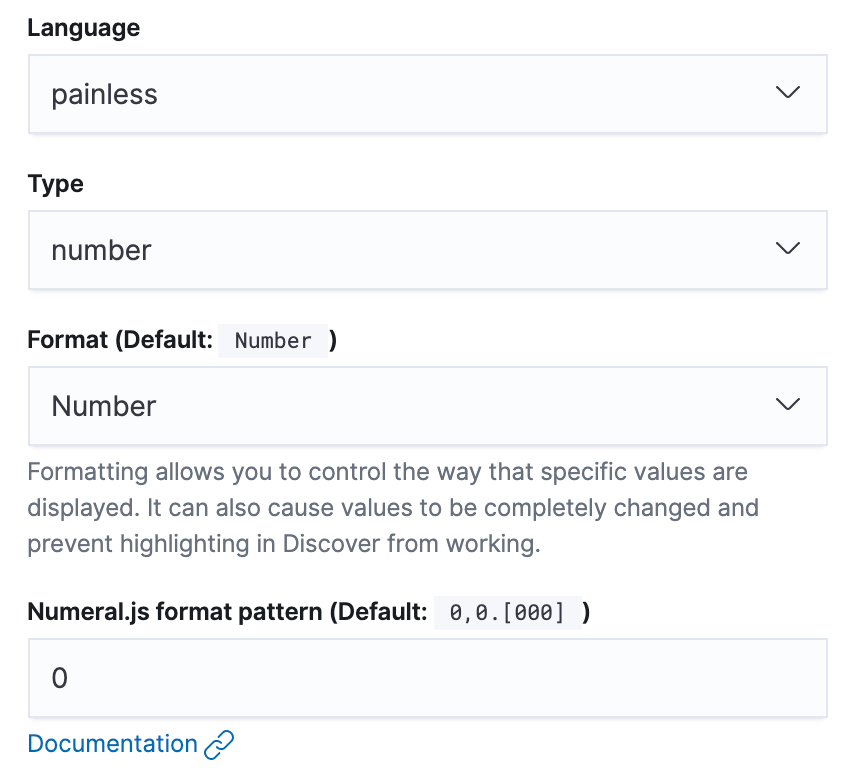
And the script:
if (doc.containsKey('time_backend_response') ) {
	return Integer.parseInt(doc['time_backend_response.keyword'].value)
}Creating a shared filter
The second issue was being able to extract out the uptime bot requests from all the other requests. We could have done this with filters in Kibana, but the issue here is that then each visualisation you create in Kibana would need to have the same filter applied to it. It also means you cannot update the filter in one place (e.g. if you find another bot to include).
Also, if you have tried doing wildcard searching in Kibana, it really is tricky to do in the UI.
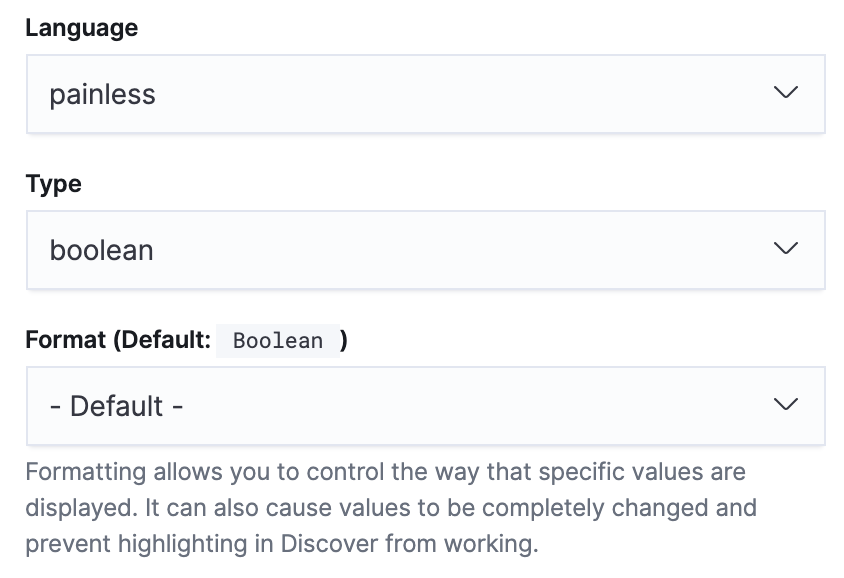
The creation of the new scripted field, this time would be a boolean (as we only cared if this request was from an uptime bot or not):
The script was a little more complex, but still manageable. The main issue I encountered early on was that some requests have no user agent attached to them, and this caused an issue until I added the && !doc['request_header_useragent.keyword'].empty guard statement.
The full script:
if (doc.containsKey('request_header_useragent.keyword') && !doc['request_header_useragent.keyword'].empty) {
    if (doc['request_header_useragent.keyword'].value.contains('StatusCake')) {
	    return true
	}
    if (doc['request_header_useragent.keyword'].value.contains('Pingdom')) {
	    return true
	}
    if (doc['request_header_useragent.keyword'].value.contains('Site24x7')) {
	    return true
	}
    if (doc['request_header_useragent.keyword'].value.contains('Uptime')) {
	    return true
	}
    if (doc['request_header_useragent.keyword'].value.contains('nagios')) {
	    return true
	}
}
return false;isUptimeBot.But wait, surely you can use regex for this?
If you have configured your ElasticSearch to support regex, you can simply the scripted field to be something like this:
if (doc.containsKey('request_header_useragent') && !doc['request_header_useragent.keyword'].empty) {
    if (doc['request_header_useragent.keyword'].value =~ /(StatusCake|Pingdom|Site24x7|Uptime|nagios)/i) {
	    return true;
	}
}
return false;
In our particular case, regex was disabled (which is the default), so I went with what worked.
Testing out the isUptimeBot filter, in this case just to list all requests that match the filter, broken down by user agent:
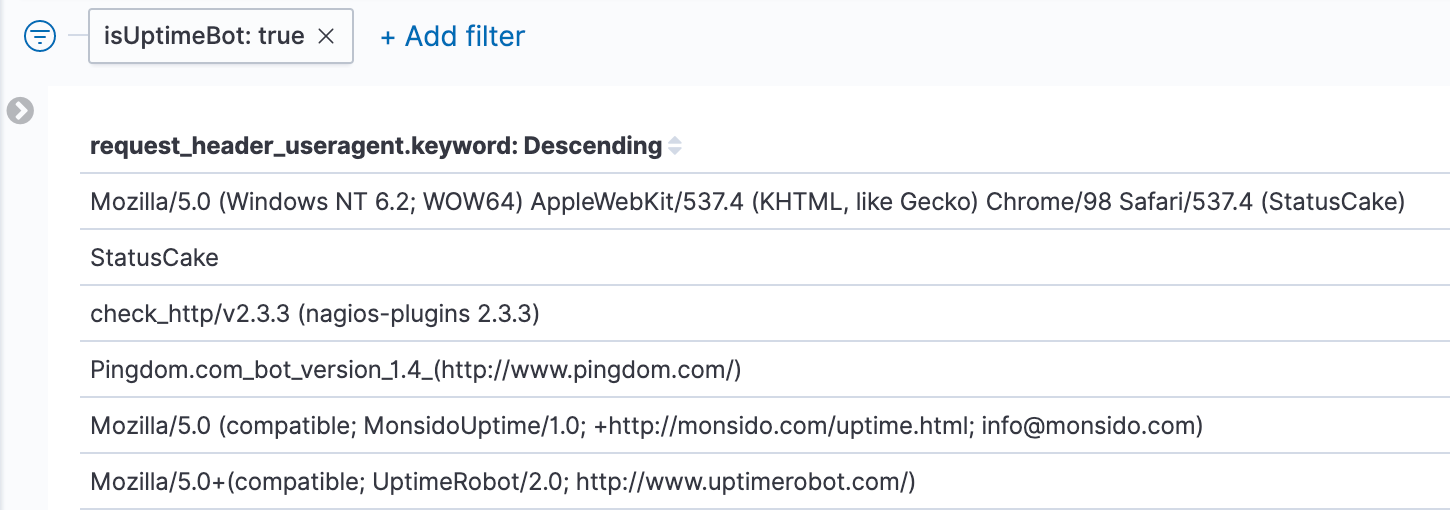
isUptimeBot scripted field.So the filter is working as intended.
Just show me the graphs
OK, so plugging in the 2 scripted fields, we can now create the visualisation that shows the impact of uptime bots vs other requests on the platform:
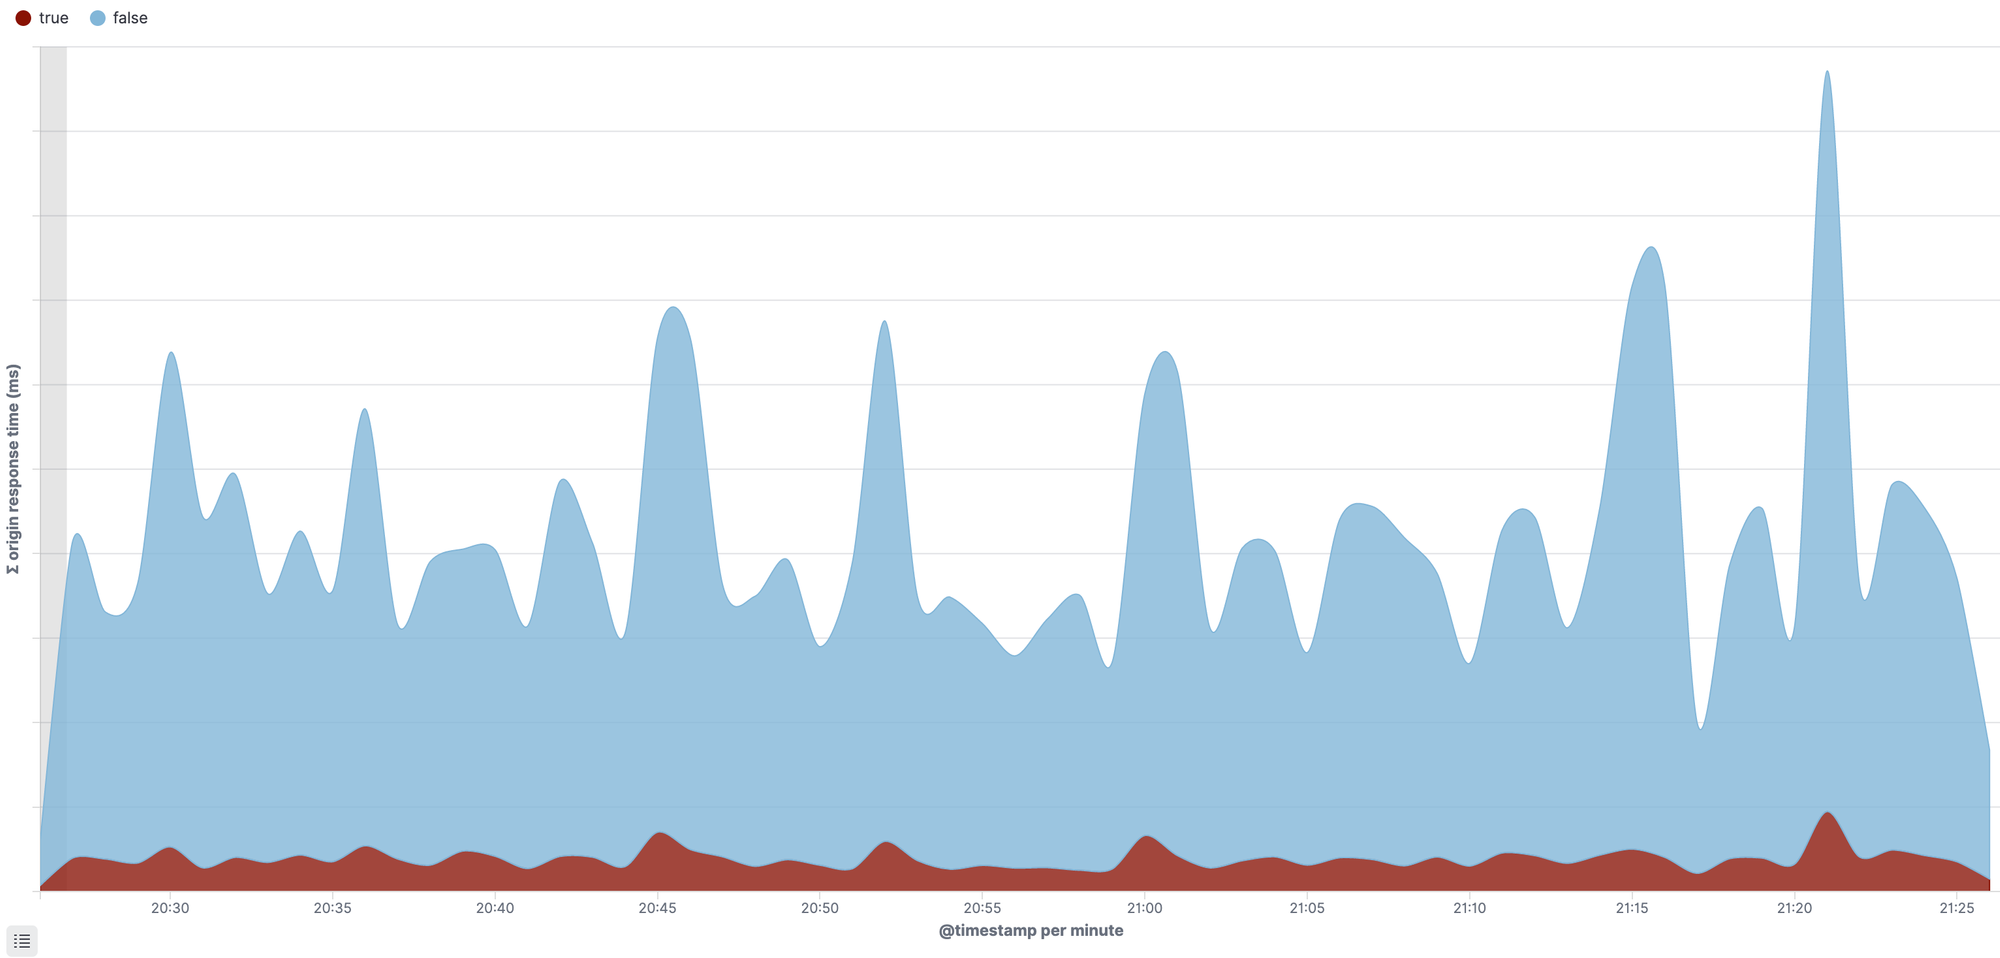
You can see the uptime bots in red, and they are constantly hitting the platform, no matter the time of day. It is a constant noise.
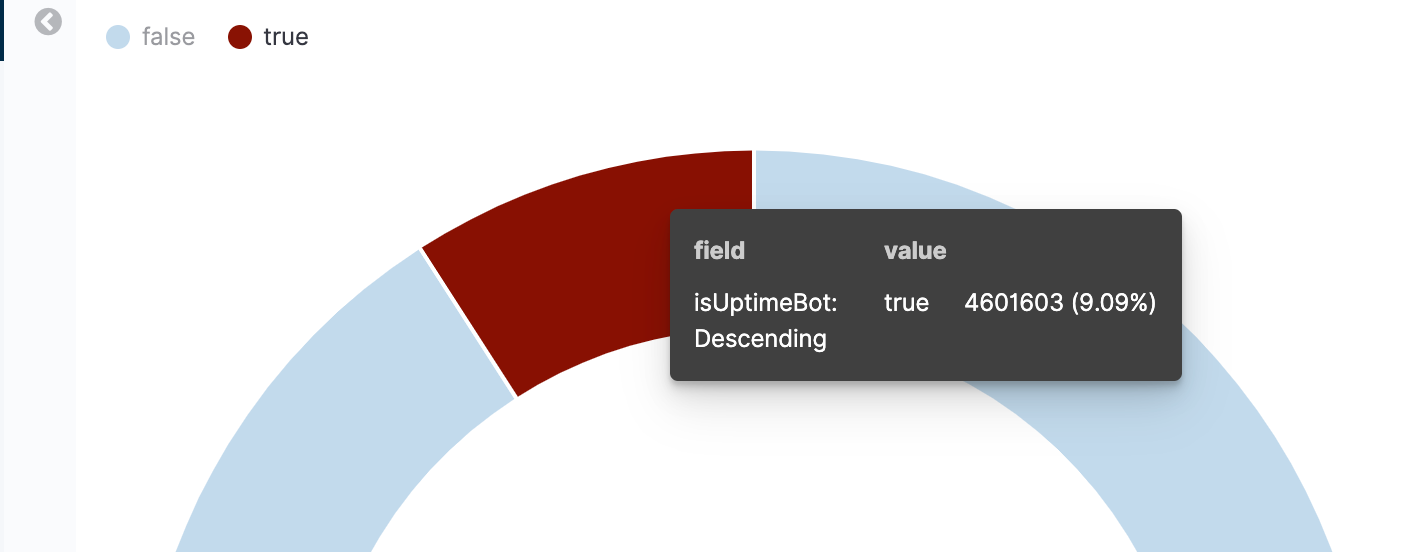
We can also recycle these same 2 scripted fields to produce this in a pie chart, this is where we see the impact is around 9.09% over the last 1 hour.
Further reading
There are a couple of really good articles I would recommend reading to go deeper than this one blog post:
- Painless Scripting in ElasticSearch - by Adam Vanderbush July 6, 2017
- Using Painless in Kibana scripted fields - by Tanya Bragin December 14, 2016
Comments
Let me know if this post helped you, and if you have any other comments or feedback.