Analysing JSON logs with OpenObserve
Level up your JSON log analysis with OpenObserve.

In years past, when I wanted to analyse a bunch of JSON logs, I would use jq. jq is an amazing tool, but suffers from some pretty massive drawbacks for large log analysis:
jqis slow. It is single threaded. Parsing a several GB file will take minutes- If you want to run multiple different reports, then you need
jqto parse it all again. So the first point becomes even more painful
Enter OpenObserve (O2). O2 is an awesome, open source (GPLv3), all in one application that is able to ingest vast quantities of logs (and other things) and be able to query them extremely quickly, and even draw visualisations and dashboards.
Think of O2 like an extremely lightweight ElasticSearch.
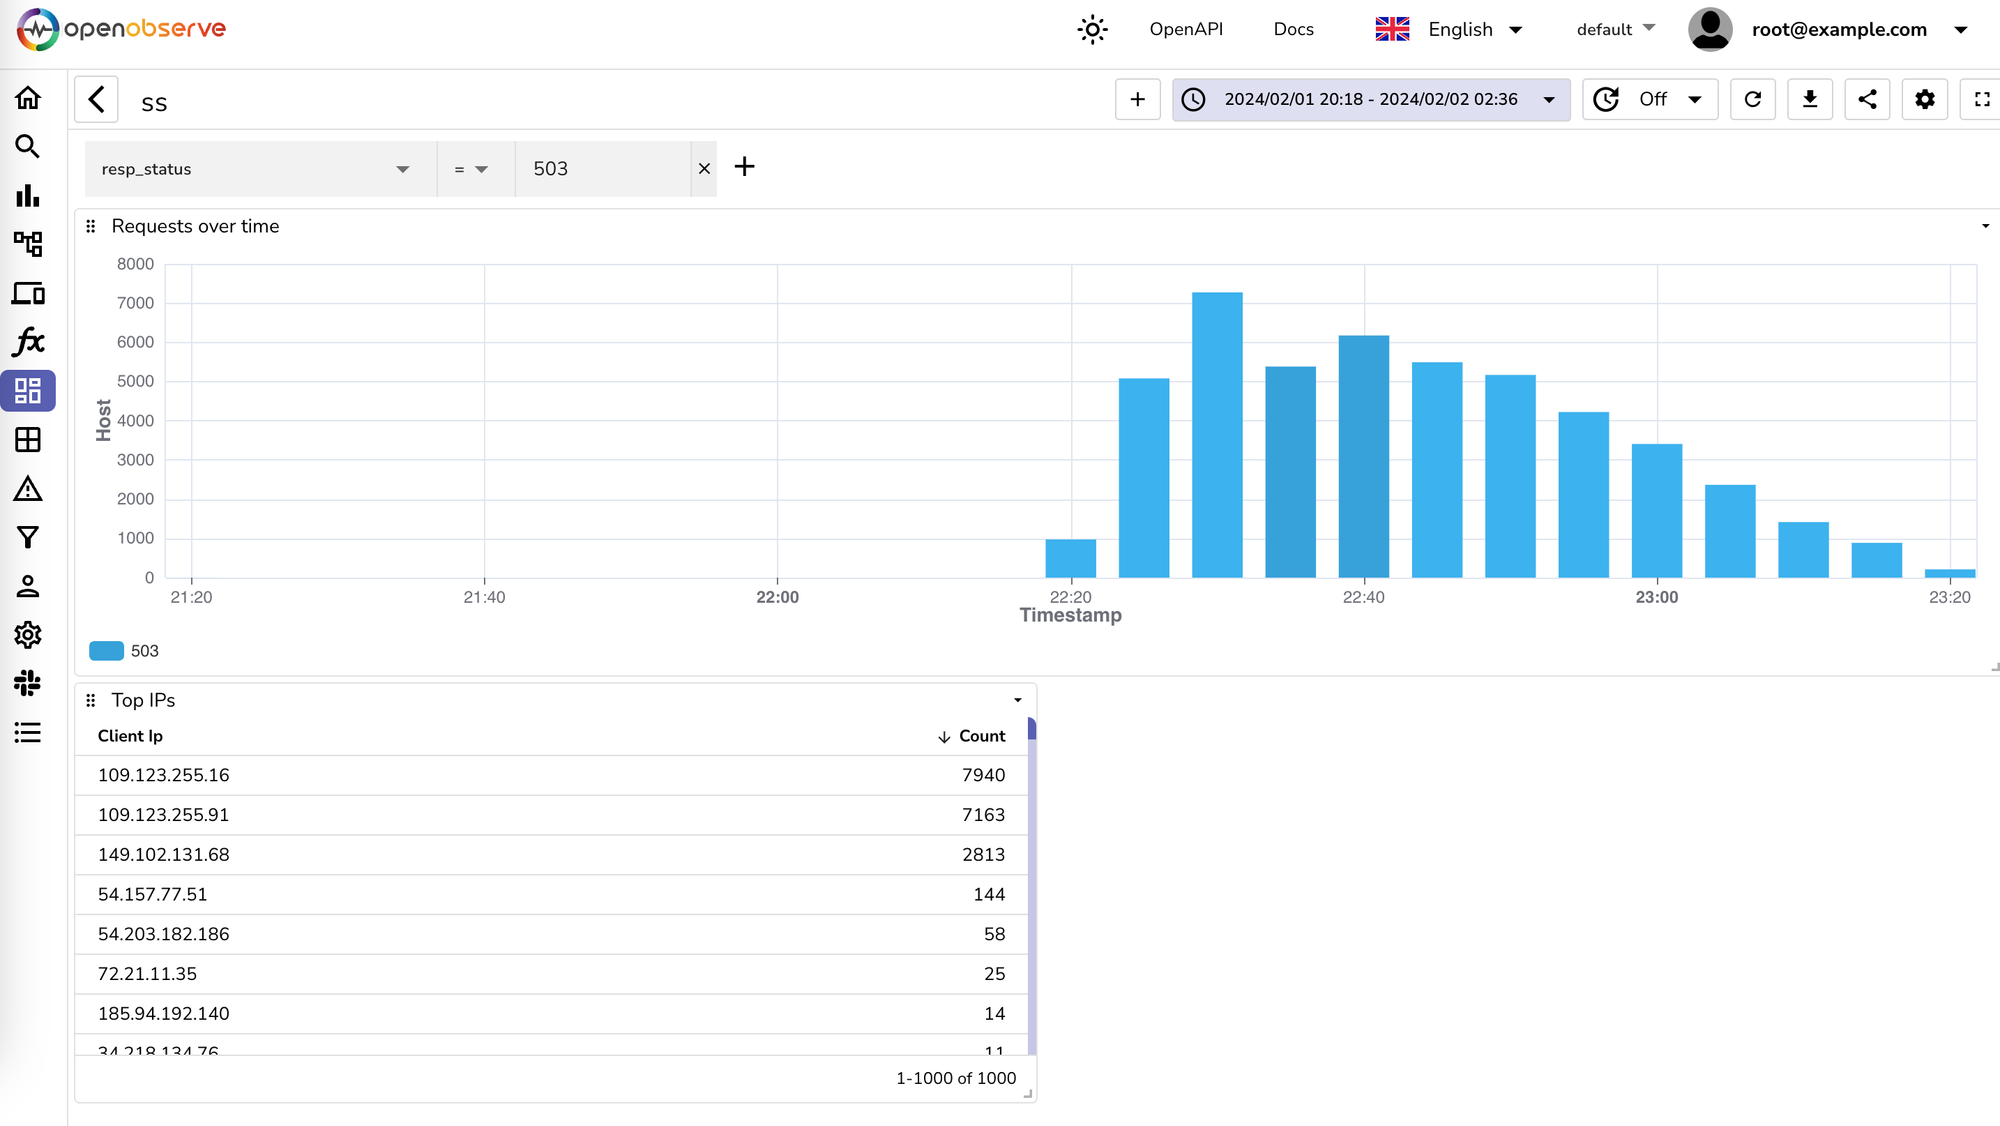
In my particular case, I often need to visualise JSON logs that come from Fastly. These logs are vast in nature, and being able to analyse millions of logs quickly is key.

The best thing (IMO) is that you can run it all locally, with a single container, and your computer will not grind to a halt in the process.
Here is a docker-compose file to get you up and running:
services:
  openobserve:
    image: public.ecr.aws/zinclabs/openobserve:latest
    restart: unless-stopped
    environment:
      ZO_ROOT_USER_EMAIL: "admin@example.com"
      ZO_ROOT_USER_PASSWORD: "password"
      ZO_INGEST_ALLOWED_UPTO: "48"
      ZO_PAYLOAD_LIMIT: "2000000000"
      ZO_JSON_LIMIT: "2000000000"
    ports:
      - "5080:5080"
    volumes:
      - data:/data
volumes:
  data:
I had to tweak a few settings (all through environment variables) to allow me to ingest hundreds of MBs in a single payload, and also allow me to ingest data up to 2 days old.
In order to get my JSON logs into a format that O2 would like, I needed to massage them a little.
O2 will automatically parse timestamps that have the name @timestamp, in my case, the field was just called timestamp. So a little sed to the rescue:
sed -i -e 's/"timestamp/"@timestamp/g' $FILEtimestamp field has a @ prefixing itI then needed to format the JSON lines into a giant JSON array, luckily someone on stackoverflow sorted this:
sed -i -e '1s/^/[/; $!s/$/,/; $s/$/]/' $FILEsedFinally, you need to send the formatted JSON array into O2
curl -u admin@example.com:password -k http://127.0.0.1:5080/api/default/default/_json --data-binary "@$FILE"If it all goes well, then you should see something like:
{"code":200,"status":[{"name":"default","successful":195001,"failed":0}]}You can now view the UI at http://localhost:5080/ and start to use the power of O2.

Happy graphing and log visualising.
