Analyzing Cloudflare Logs (formally ELS) with the command line
If you have an enterprise zone with Cloudflare, there is the ability to request the raw request logs using 'Cloudflare Logs' (formally called Enterprise Log Share or ELS for short).
If you have an enterprise zone with Cloudflare, there is the ability to request the raw request logs using 'Cloudflare Logs' (formally called Enterprise Log Share or ELS for short).
Cloudflare logs comes in 2 flavours, "Log Push" (e.g. to an S3 bucket) and "Log Pull" (using the REST API). In this blog post I will be covering the REST API, as I find analyzing the data easier on my local laptop.
If you have Splunk or Sumologic (or similar), then likely Log Push will be better suited to you.
How to download your Cloudflare logs using the REST API
Step 1: Ensure Cloudflare Logs are enabled for your zone
This is a manual step, and it requires you to raise a ticket with Cloudflare in order to enable it. It would be super if there was an API endpoint to both read and write this feature flag, but alas, manual it is for now.
You can en-masse enable Cloudflare logs for many zones in the same ticket, so save some time and enable it for all your enterprise zones now would be advice. There is literally no downside to enabling it (assuming you don't store silly things like credit card numbers in the URL).
It is also important to note that the logs are only captured from the point you enable the service, they do not retroactively appear. So if you are experiencing issues, and you don't have Cloudflare Logs already enabled, you may have missed out on collecting critical data.
Step 2: Get your Cloudflare Global API key
You get this from your user profile in Cloudflare
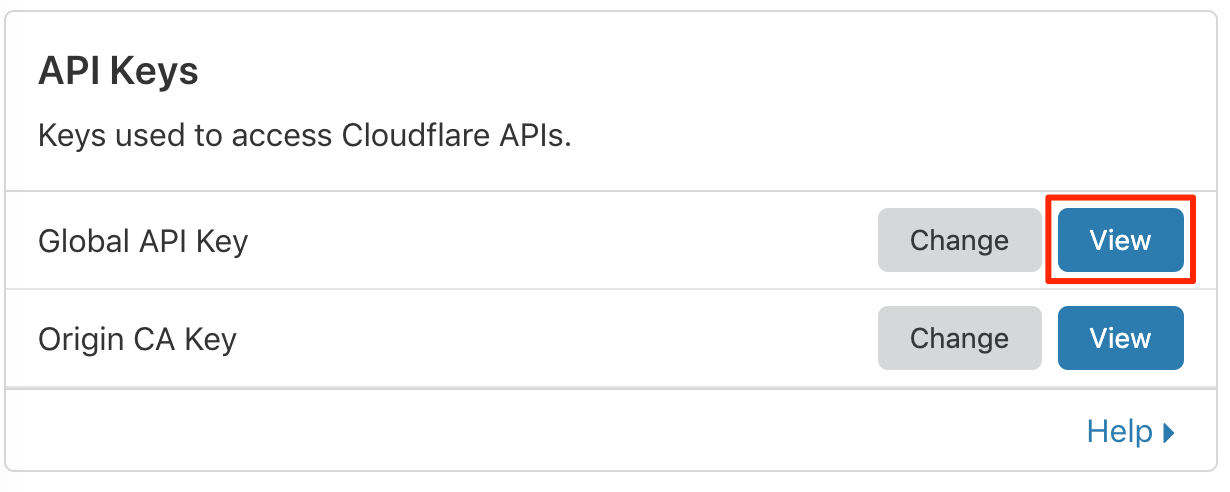
Treat this API key like you would your password, keep it safe.
Step 3: Use your favourite tool or language to download the logs
Now that you have your email address and Global API key, you can start to use the Cloudflare REST API to retrieve the logs.
Here is an example to download 1 hour's worth of logs. There is an offset of 5 minutes in the past (to ensure you get a full 1 hours worth of logs, as there is a delay). This will work so long as the zone does not have loads of traffic (as there is a 1GB limit on the download).
ZONE_ID=XXXX
CLOUDFLARE_EMAIL=bob@example.com
CLOUDFLARE_KEY=XXXXXX
STARTDATE=$(($(date +%s)-3900))
ENDDATE=$((STARTDATE+3600))
FILENAME="/tmp/${ZONE_ID}-${STARTDATE}-${ENDDATE}.log"
FIELDS=$(curl -s -H "X-Auth-Email: ${CLOUDFLARE_EMAIL}" -H "X-Auth-Key: ${CLOUDFLARE_KEY}" "https://api.cloudflare.com/client/v4/zones/${ZONE_ID}/logs/received/fields" | jq '. | to_entries[] | .key' -r | paste -sd "," -)

curl -s \
  -H "X-Auth-Email: ${CLOUDFLARE_EMAIL}" \
  -H "X-Auth-Key: ${CLOUDFLARE_KEY}" \
  "https://api.cloudflare.com/client/v4/zones/${ZONE_ID}/logs/received?start=${STARTDATE}&end=${ENDDATE}&fields=${FIELDS}" \
  > "${FILENAME}" \
  && echo "Logs written to ${FILENAME}"
There is actually a lot of information in a single request, and a large JSON object is returned. You can get a sense of this below (dummy data has been substituted):
$ head -n1 ${FILENAME} | jq
{
  "CacheCacheStatus": "hit",
  "CacheResponseBytes": 89846,
  "CacheResponseStatus": 200,
  "CacheTieredFill": false,
  "ClientASN": 9304,
  "ClientCountry": "hk",
  "ClientDeviceType": "desktop",
  "ClientIP": "118.143.70.210",
  "ClientIPClass": "noRecord",
  "ClientRequestBytes": 1928,
  "ClientRequestHost": "www.example.com",
  "ClientRequestMethod": "GET",
  "ClientRequestPath": "/scripts/app.built.js",
  "ClientRequestProtocol": "HTTP/1.1",
  "ClientRequestReferer": "https://www.example.com/",
  "ClientRequestURI": "/scripts/app.built.js?puhl4d",
  "ClientRequestUserAgent": "Mozilla/5.0 (Windows NT 6.1; Trident/7.0; rv:11.0) like Gecko",
  "ClientSSLCipher": "ECDHE-RSA-AES128-SHA",
  "ClientSSLProtocol": "TLSv1.2",
  "ClientSrcPort": 33177,
  "EdgeColoID": 23,
  "EdgeEndTimestamp": 1563271736447000000,
  "EdgePathingOp": "wl",
  "EdgePathingSrc": "macro",
  "EdgePathingStatus": "nr",
  "EdgeRateLimitAction": "",
  "EdgeRateLimitID": 0,
  "EdgeRequestHost": "www.example.com",
  "EdgeResponseBytes": 89194,
  "EdgeResponseCompressionRatio": 0,
  "EdgeResponseContentType": "application/javascript",
  "EdgeResponseStatus": 200,
  "EdgeServerIP": "",
  "EdgeStartTimestamp": 1563271736404000000,
  "FirewallMatchesActions": [],
  "FirewallMatchesSources": [],
  "FirewallMatchesRuleIDs": [],
  "OriginIP": "",
  "OriginResponseBytes": 0,
  "OriginResponseHTTPExpires": "",
  "OriginResponseHTTPLastModified": "",
  "OriginResponseStatus": 0,
  "OriginResponseTime": 0,
  "OriginSSLProtocol": "unknown",
  "ParentRayID": "00",
  "RayID": "4f732d708c26d1ee",
  "SecurityLevel": "med",
  "WAFAction": "unknown",
  "WAFFlags": "0",
  "WAFMatchedVar": "",
  "WAFProfile": "unknown",
  "WAFRuleID": "",
  "WAFRuleMessage": "",
  "WorkerCPUTime": 0,
  "WorkerStatus": "unknown",
  "WorkerSubrequest": false,
  "WorkerSubrequestCount": 0,
  "ZoneID": 12345
}
Analyse your Cloudflare logs
Now that you have the raw data, you should look to turn it into something you can make business decisions with.
Here are some simple analysis you can do with the jq tool (ensure you install this first if you have not already).
Top URIs
jq -r .ClientRequestURI ${FILENAME} | sort -n | uniq -c | sort -nr | head -n 3

3716 /scripts/app.built.js
1331 /images/sample.png
 642 /
Top user agents
jq -r .ClientRequestUserAgent ${FILENAME} | sort -n | uniq -c | sort -nr | head -n 3

1507 Mozilla/5.0 (Windows NT 10.0; Win64; x64) AppleWebKit/537.36 (KHTML, like Gecko) Chrome/75.0.3770.100 Safari/537.36
1364 Mozilla/5.0 (Windows NT 6.1; WOW64; Trident/7.0; rv:11.0) like Gecko
1014 Mozilla/5.0 (iPhone; CPU iPhone OS 12_3_1 like Mac OS X) AppleWebKit/605.1.15 (KHTML, like Gecko) Version/12.1.1 Mobile/15E148 Safari/604.1
Top HTTP 404s
Slightly more complex query, but certainly still readable.
jq 'select(.EdgeResponseStatus == 404) | "\(.ClientRequestHost)\(.ClientRequestURI)"' ${FILENAME} | sort -n | uniq -c | sort -nr | head -n 3

 197 "www.example.com/images/globalnav/example.gif"
 195 "www.example.com/images/excelmark200_blue_300dpi.png"
  49 "www.example.com/includes/fonts/318130/AFD64F04666D9047C.css"
Top IPs triggering the WAF
jq -r 'select(.WAFAction == "drop") | .ClientIP' ${FILENAME} | sort -n | uniq -c | sort -nr | head -n 3

   1 58.11.157.113
   1 18.212.21.164
There are other examples on Cloudflare's own documentation site if you wish to pursue this further. Mostly this is just a matter of knowing how to use jq.
Extra for experts
Using jq is fun for some basic analysis, at some point you will want something more comprehensive. Here are some of the more unique things I have done to help show off this data. This likely will involve using a programming language, and having some form of presentation output (e.g. HTML) from it.
HTML tables
Having the data in HTML makes it more presentable.
On a side note, I often find the offload of the CDN is one number that is the most critical for caching, that is missing from the Cloudflare UI. Here the offload of 64.38% indicates that Cloudflare has removed around two thirds of all requests from your origin platform. Given enough time, energy and traffic you can tune this number to be > 99.9%.
| Layer that served request | Requests |
|---|---|
| Edge | 103,916 |
| Cache | 435,913 |
| Re-Validated from origin (HTTP 304) | 25,550 |
| Origin | 312,878 |
| Offload | 64.38% |
Integration with Highcharts
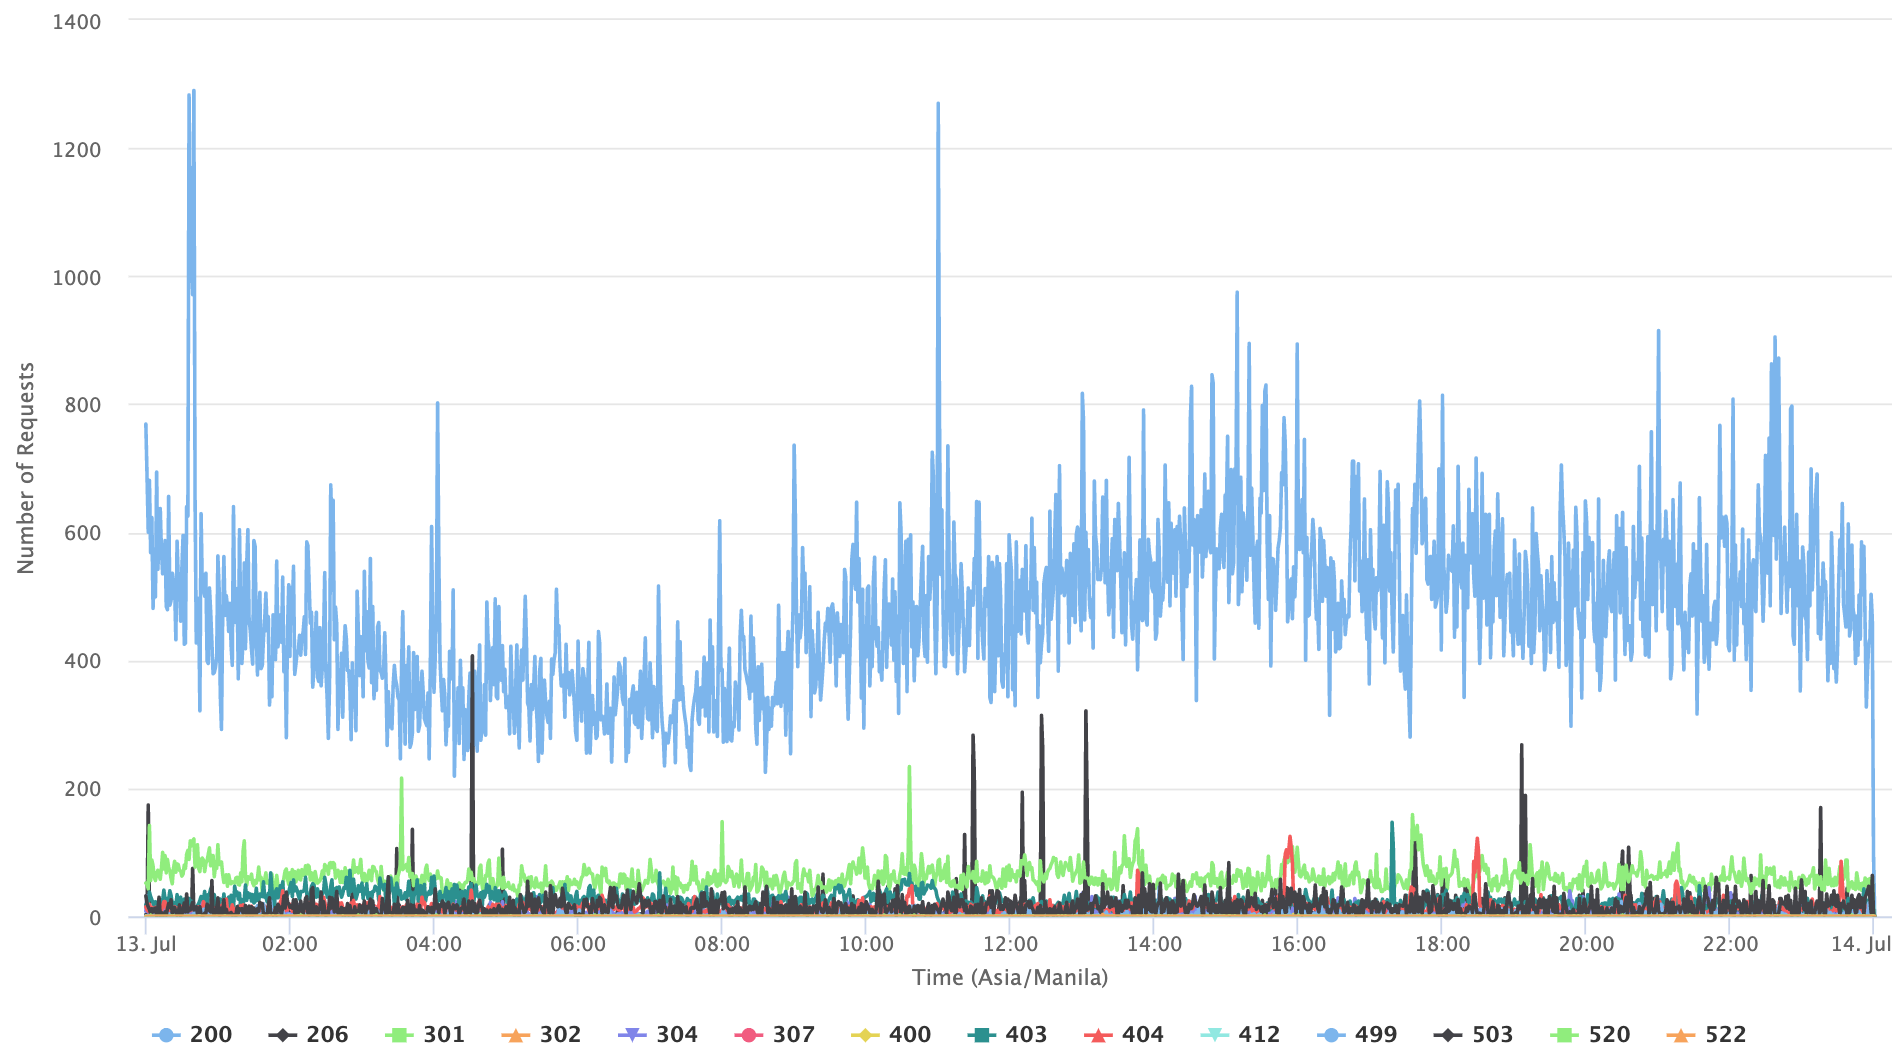
Highcharts is a Javascript powered graphing library. It supports zooming, and removing series by clicking on them. Fairly fancy, and great for graphing time based data. Here is 24 hours of data, broken down by minute (the Cloudflare UI does not allow this granularity).
Integration with Geckoboard
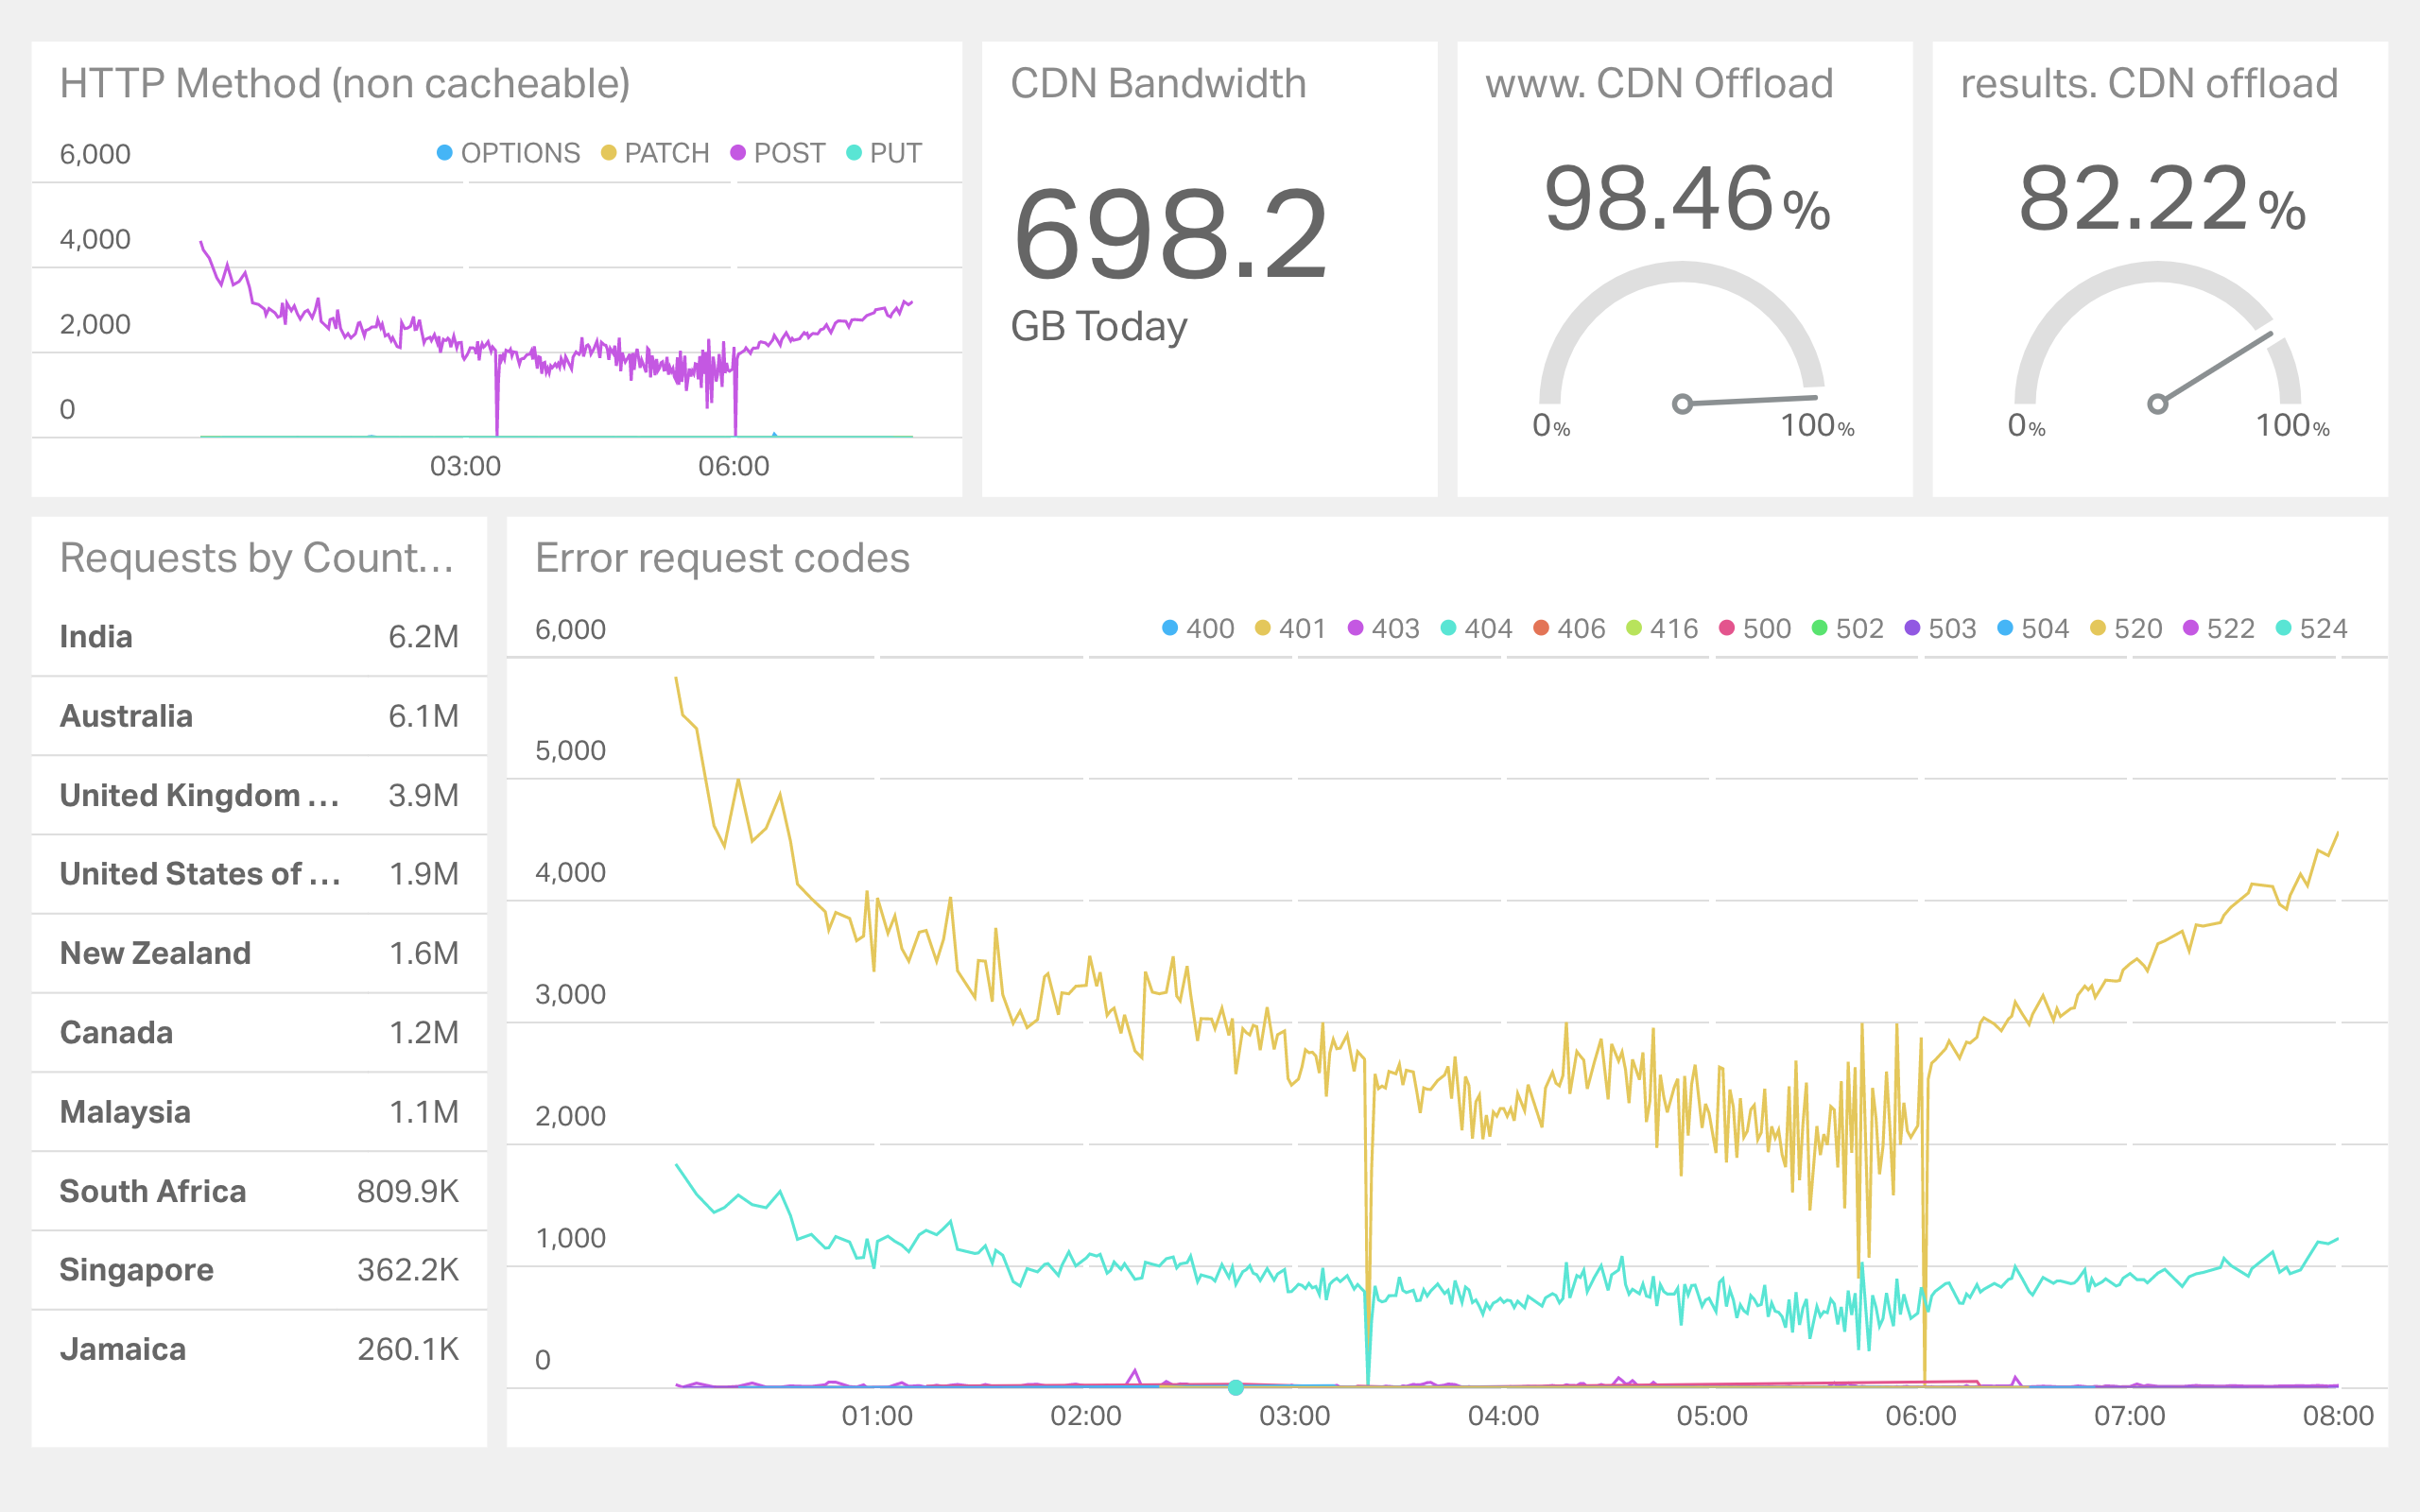
If you need something more realtime, then Geckoboard is a simple solution. Geckoboard supports custom datasets, and allows you to send arbitrary data to it. Here is a real dashboard for a high traffic event
Logstalgia
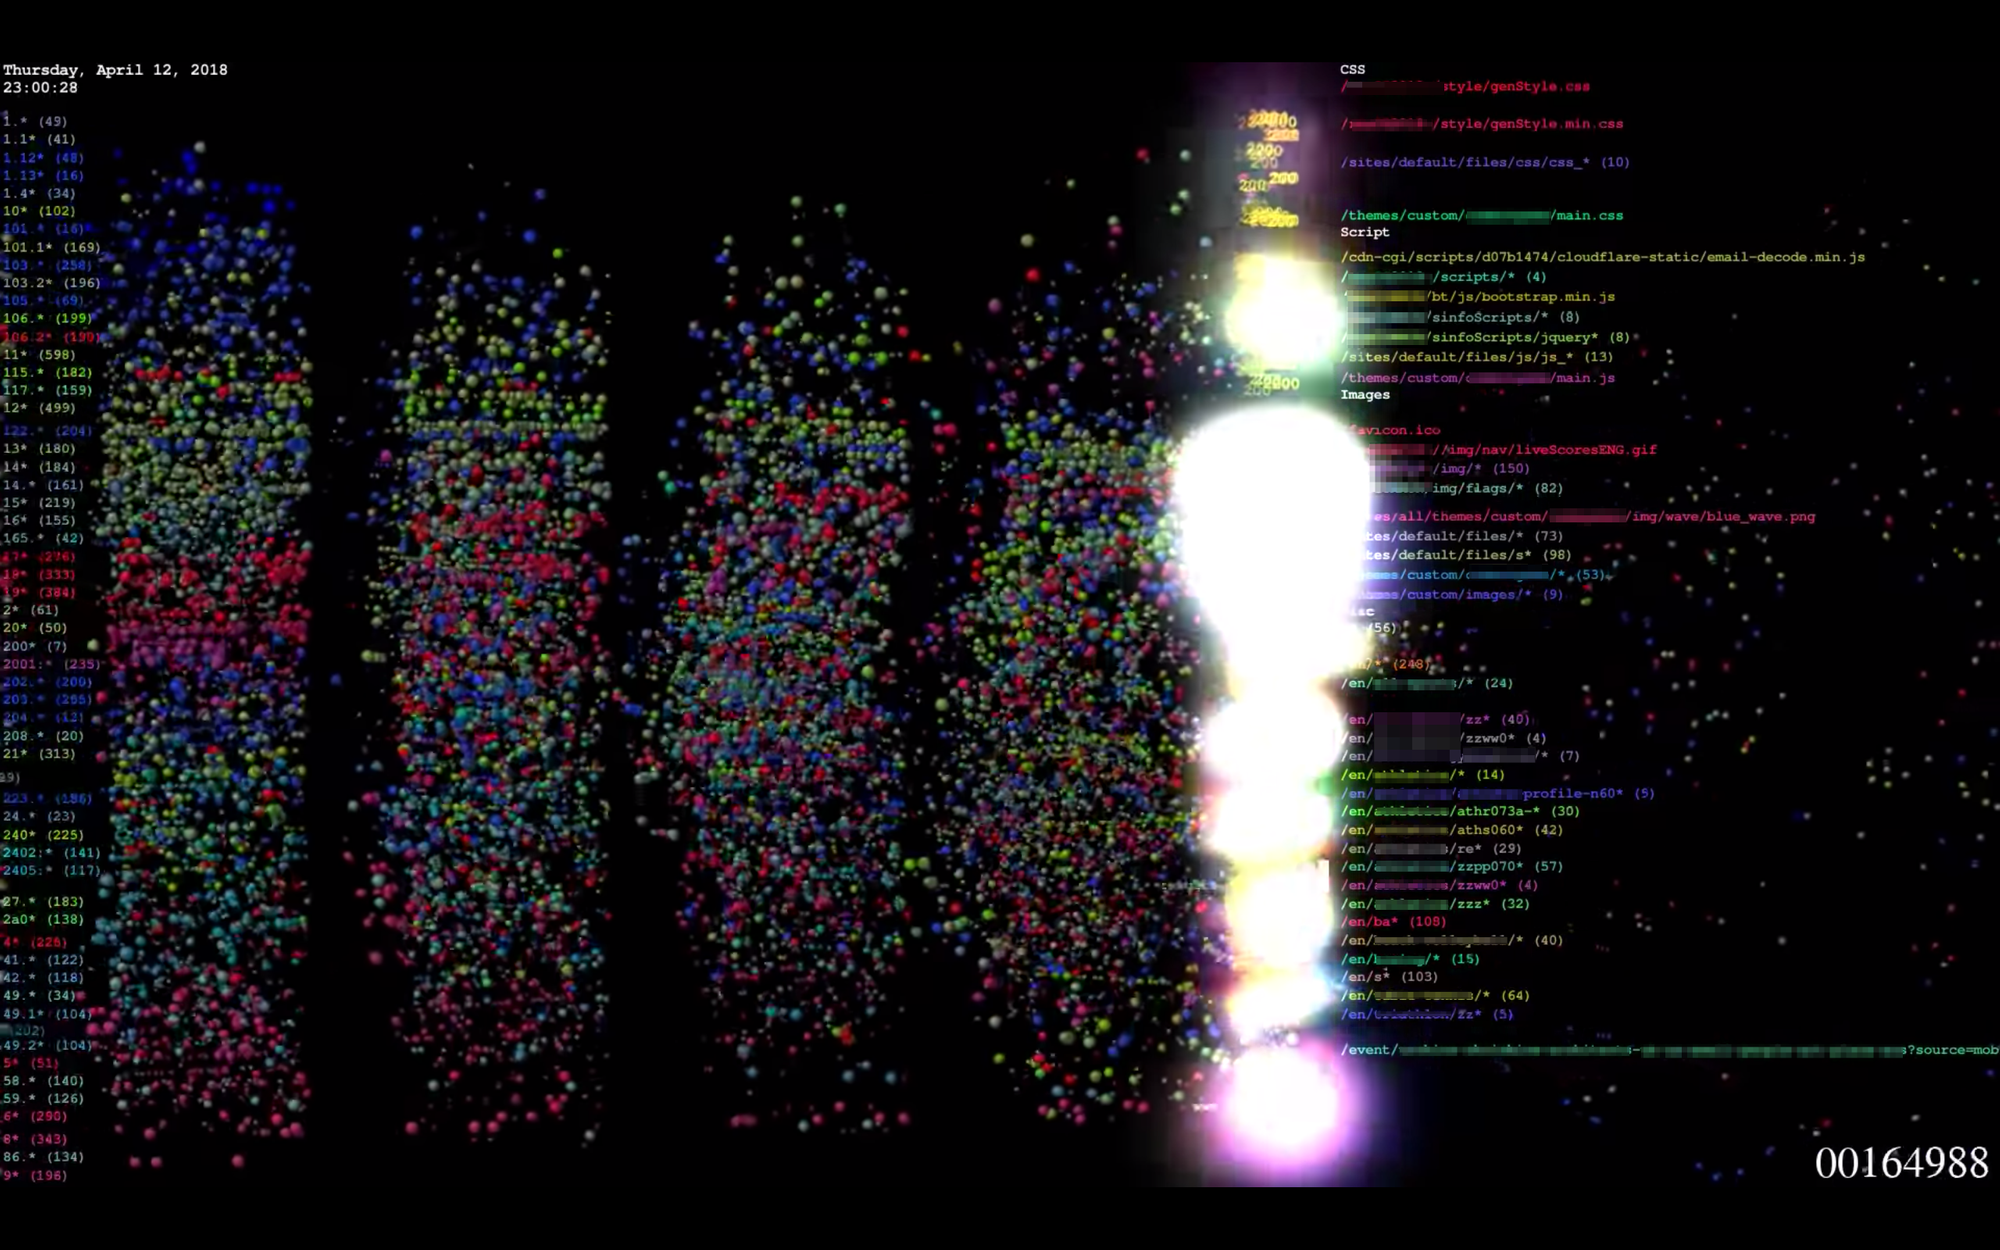
If you convert the JSON format into Apache format you can use this rather unique visualization. Logstalgia ends up producing a pong-like representation of the traffic and the paddles are the virtual hosts. Fun stuff to have on the TV on your office wall if you have one free. See the official site for more information on how to install and use this.
Comments
If you have done something unique with Cloudflare Logs (and are allowed to share it), please let me know in the comments.
