How to profile PHP memory with Drupal
Simple steps to tune your application

Why is this important
How to size the PHP setting max_memory is actually really important for the health of your Drupal application. Size this too small, and you risk getting PHP fatals due to not enough memory allocated. Size this too large, and you are essentially under-utilising your hardware, which in turn can lead to more cost.
How to record every Drupal requests PHP max memory usage
Tim Hillard created this really nice module called Memory profiler, which probably wins some sort of award for being around one of the smallest modules on drupal.org. Essentially this module registers a shutdown function that gets called at the end of every normal Drupal request.
The module is lightweight enough to run on production and only produces an extra syslog line per request.
Analyse the data
The data for memory profiler flows into watchdog, so if you run syslog (which you should), you can use CLI tools to analyse the data.
What does a single request look like
$ grep "memory profiler" drupal-watchdog.log | head -n 1

May 26 06:25:21 10.212.4.16 sitename: https://www.sitename.com|1432621521|memory profiler|1.152.97.17|https://www.sitename.com/|https://www.sitename.com/home|0||4.75 MB - home request_id="v-fc9573dc-036f-11e5-a8c0-22000af91462"
This comes from your syslog format (which can be changed on a per site basis):
$ drush vget syslog_format

syslog_format: '!base_url|!timestamp|!type|!ip|!request_uri|!referer|!uid|!link|!message'
Extract the data from syslog
From here you can tokenise the parts you actually care about, in other words the:
- URL requested (part 5)
- PHP max memory (part 9)
Using more bash foo
$ grep "memory profiler" drupal-watchdog.log | head -n 1 | awk -F'|' -v OFS=',' '{print $5, $9}'

https://www.sitename.com/,4.75 MB - home request_id="v-fc9573dc-036f-11e5-a8c0-22000af91462"
On Acquia Cloud a request ID is added to all requests, we don’t need this. Also having the string ‘MB’ there is superfluous.
$ grep "memory profiler" drupal-watchdog.log | head -n 1 | awk -F'|' -v OFS=',' '{print $5, $9}' | sed 's/ MB.*//'

https://www.sitename.com/,4.75
Perfect.
So in order to create a CSV for analysing in a spreadsheet you could do:
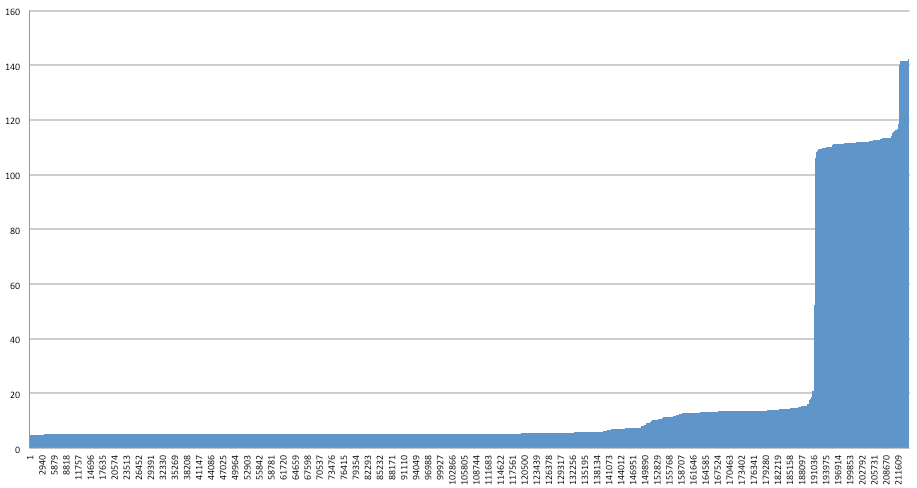
$ echo "request_uri,max_memory" > /tmp/memory.csv && grep "memory profiler" drupal-watchdog.log | awk -F'|' -v OFS=',' '{print $5, $9}' | sed 's/ MB.*//' >> /tmp/memory.csvAnd then you can make pretty graphs if you want:

Or if you just want to find the top requests to your application by memory you can do
$ grep "memory profiler" drupal-watchdog.log | awk -F'|' -v OFS=',' '{print $5, $9}' | sed 's/ MB.*//' | sort -t, -k+2 -n -r | head -n 20Conclusions
Based on your findings in the logs, you should be able to come up with:
- A better understanding of your request memory profile
- Better max memory settings for your Drupal application
- Potentially identify poor performing pages (memory wise) and can look to optimise them
Gotchas
This module will only work if:
hook_boot()is called (which might not be the case if you run custom lightweight PHP scripts that do not bootstrap Drupal)- The Drupal request is not terminated with a
SIGTERMorSIGKILLsignal
Comments
Let me know if you found this helpful, or if you have any changes to my bash foo. If you have profiled your Drupal application recently, what methods and tools did you use?
