Measuring Drupal content growth over time
A graphical way to see how your Drupal site content is growing over time

On a recent project I was tasked with working out why the database was so large, in particular certain tables like field_revision_body and field_data_body had grown to be several gigabytes in size.
SQL to the rescue
Here is a simple SQL statement you can execute on your production database to retrieve a count of nodes created grouped by day.
drush --uri=www.example.com sqlq "SELECT count(nid) as count, DATE_FORMAT(FROM_UNIXTIME(created),'%d-%m-%Y') AS month FROM node GROUP BY YEAR(FROM_UNIXTIME(created)), MONTH(FROM_UNIXTIME(created)), DAY(FROM_UNIXTIME(created))" > /tmp/example-nodes.txtPostgreSQL users - you can add a custom function to add FROM_UNIXTIME functionality:
CREATE OR REPLACE FUNCTION from_unixtime(integer) RETURNS timestamp AS '
     SELECT to_timestamp($1)::timestamp AS result
' LANGUAGE 'SQL';
Cleaning up results
The SQL will return in a few seconds, and now we need to clean up the data before it is graphed. First lets trim the start of the file, here you can see a few nodes with no valid date, and 1 created in 1980, we want to remove these lines.
head /tmp/example-nodes.txt

count	month
662	NULL
1	08-06-1980
194	30-06-1992
198	01-07-1992
186	02-07-1992
...
Now if we look at the tail you can see a few nodes that are created in the future, I also like to remove these from the results as they tend to blow out the timescale of any graphs:
tail /tmp/example-nodes.txt

1	15-04-2022
12	30-05-2022
1	19-06-2022
1	24-06-2022
1	27-06-2022
...
Conversion to CSV
By default the SQL will return a tab separated values file, and with blank lines in there, lets convert this to CSV and enforce consistent line endings:
cat /tmp/example-nodes.txt | sed $'s/\r//' | tr "\\t" "," > /tmp/example-nodes.txtGraphing results
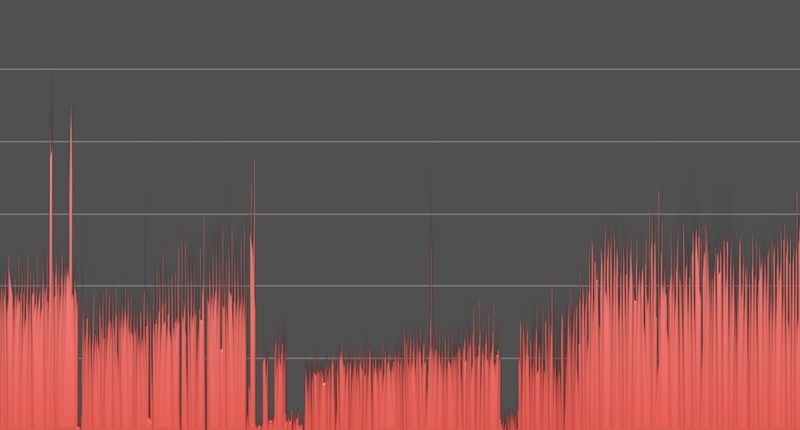
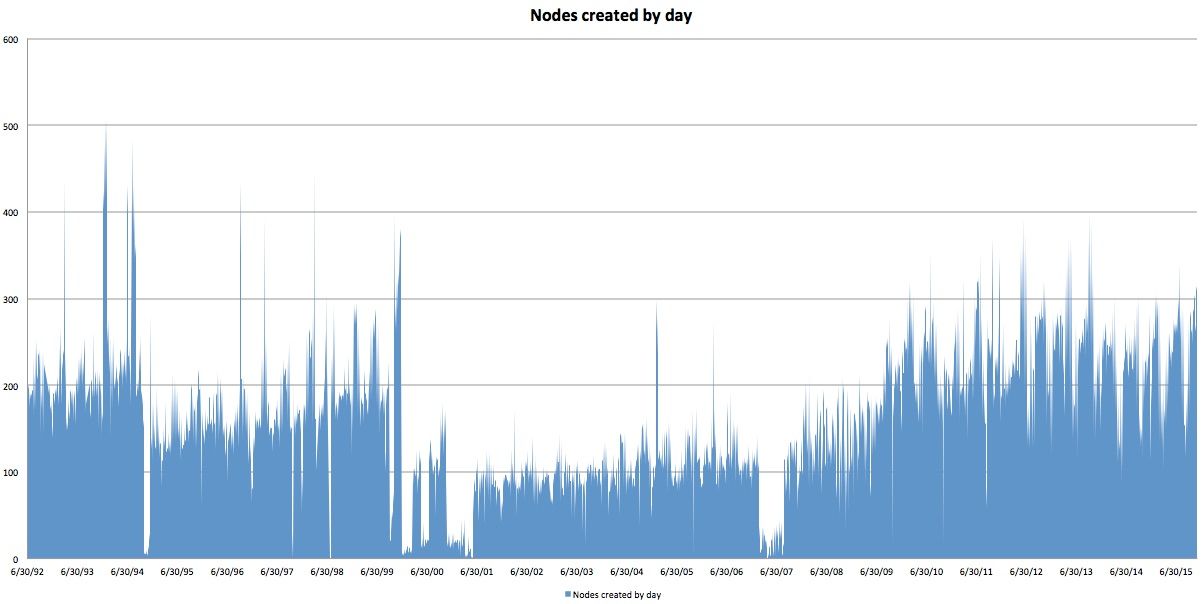
Now that you have clean data you can import into your favourite graphing tool, here is Excel making a graph of that data. Here are the number of nodes created by day:
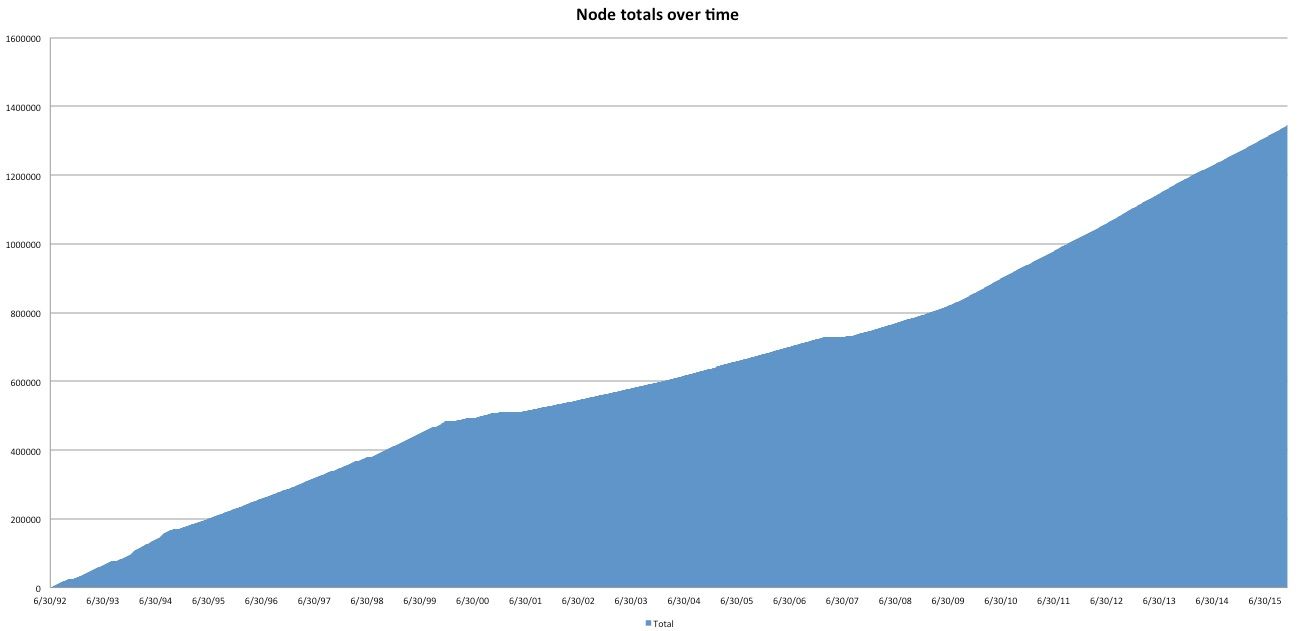
And if you make the total cumulative, you can track total growth in Drupal, and use this to predict into the future:
Wait, what about taxonomy terms
You can extend this method to work with taxonomy terms as well with a slight modification to the SQL (Drupal 7):
drush --uri=www.example.com sqlq "SELECT count(tid) as count, DATE_FORMAT(FROM_UNIXTIME(created),'%d-%m-%Y') AS month FROM taxonomy_term_data GROUP BY YEAR(FROM_UNIXTIME(created)), MONTH(FROM_UNIXTIME(created)), DAY(FROM_UNIXTIME(created))" > /tmp/example-terms.txtWhere to from here
Based on the analysis, you might be able to make recommendations to:
- perhaps look at exporting (e.g. with node_export) and removing content from Drupal’s database after X number of years. This will reduce the database size immediately
- removing unused revisions from content where the content is older than X number of years
- predict into the future how many nodes you will have in 1 year, 5 years etc and be able to plan for this in terms of hardware capacity
Comments
If you are having challenges with Drupal content growing over time, how are you keeping track of this? Are there any other tips and tricks you know about?