Profiling Drupal 7 performance with XHProf and Devel
Find out why Drupal is consuming the memory it is


There often comes a time when you wonder why your page is occasionally experiencing a PHP Out Of Memory error with Drupal. Without profiling tools, you have no idea why Drupal is consuming the memory it is. Luckily the team at Facebook have created the tool XHProf.
How to install XHProf with apache
This can be done entirely with PECL:
pear channel-update pear.php.net
sudo apt-get install php5-common graphviz
sudo pecl config-set preferred_state beta
sudo pecl install xhprof
Create the directory for the data to live in, I choose to use /tmp but you can choose another location for more permanent storage
mkdir /tmp/xhprof
chmod 777 /tmp/xhprof
If you use apache, then setting this up is trivial. First create the settings file (included automatically)
sudo vim /etc/php5/conf.d/xhprof.iniInsert:
[xhprof]
extension=xhprof.so
xhprof.output_dir="/tmp/xhprof"
Then let apache know that all URLs beginning with “xhprof_html” are indeed XHProf URLs.
sudo vim /etc/apache2/conf.d/xhprof.confInsert:
alias /xhprof_html "/usr/share/php/xhprof_html/"Restart Apache
sudo service apache2 restartDrupal 7 integration with Devel
The devel module makes the integration with XHProf as simple as enabling the module and setting some variables.
drush dl devel
drush en devel
drush vset devel_xhprof_enabled 1
drush vset devel_xhprof_directory "/usr/share/php"
drush vset devel_xhprof_url "/xhprof_html"
And there you have it, now all your pages will be profiled as they are generated, and Devel will embed a link at the bottom of the page in order to view the metrics, and call graph trace.
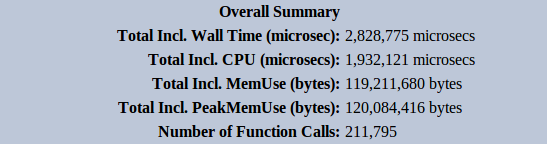
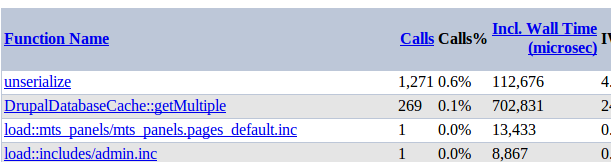
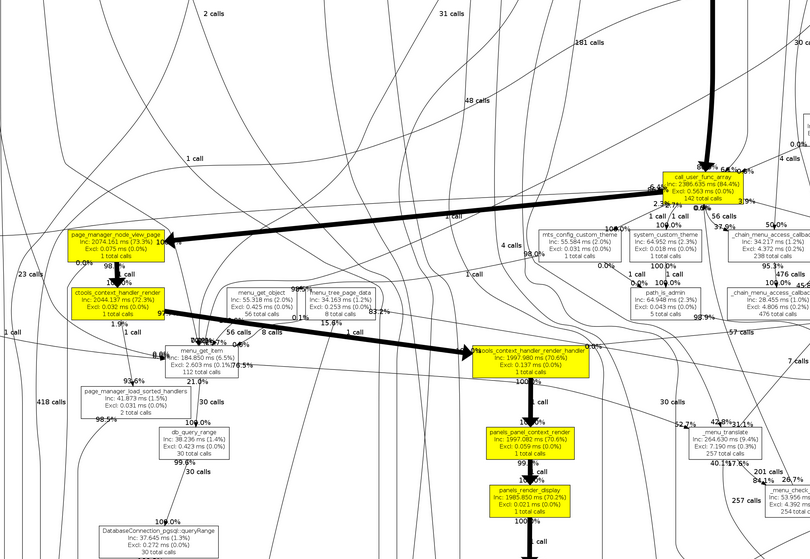
Screenshots
Here are some images snapped from a recent project on a complex page generation: